
Ontonix has announced today the release of version 6.0 of its flagship software system OntoSpace. The full Press Release is available here.
One of the salient new features is the new display of Business Structure Maps, illustrated below. One may notice that now each node of the map has different dimensions. These are computed based on the Complexity profile, i.e. size is function of the node's importance (footprint) on the entire system. This allows to focus immediately on the important issues.

This is what the above map looked like in the previous version released in 2010.

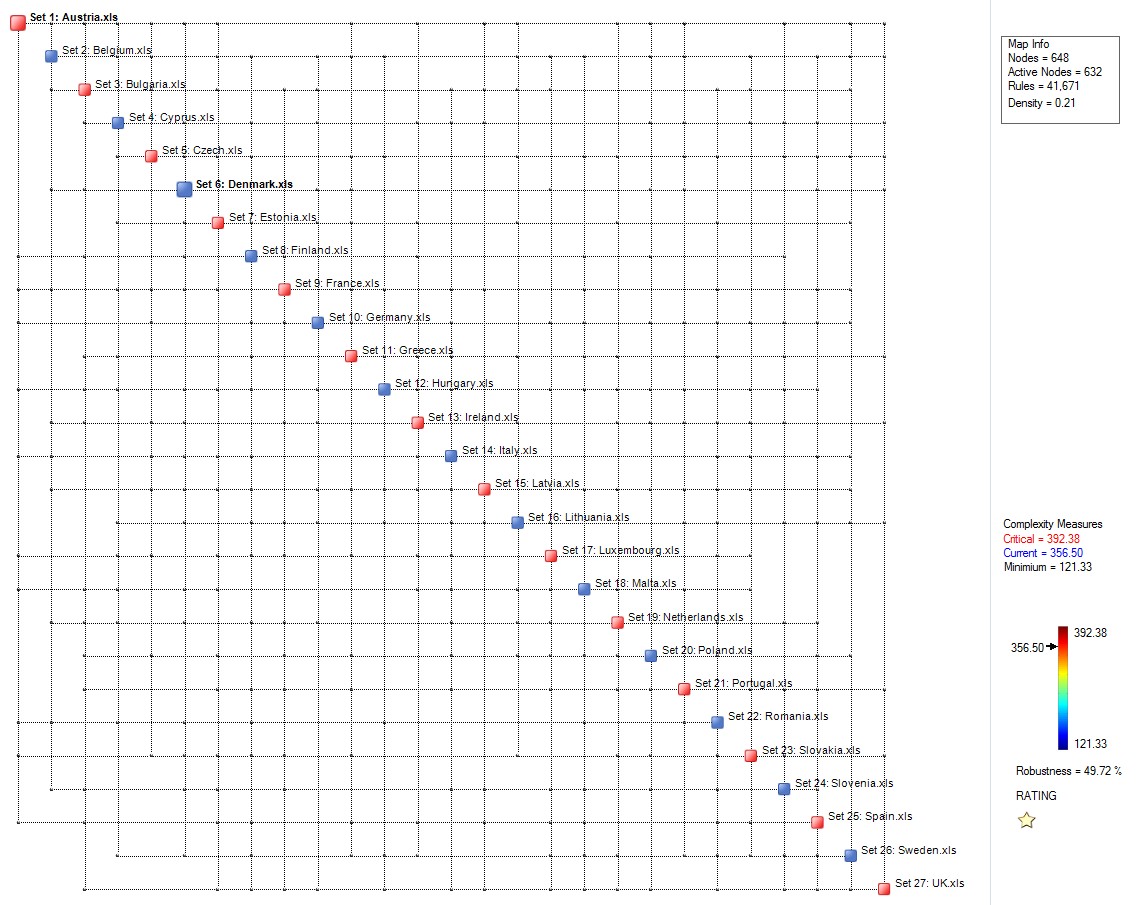
But there is more. In very large cases, things become difficult to grasp (this happen not only with OntoSpace but in life in general). Consider, for example, the Business Structure Map of the EU (each group of nodes, depicted either in blue or red - alternating colours are used to enables users to distinguish the various groups - corresponds to a country).

Not very clear is it? In fact, the map has 632 nodes which are interconnected by 41671 rules! How do you go about analysing that? Well, you can't. For this reason OntoSpace v6.0 supports the so-called Meta-maps, which are obtained from the above map by grouping all variables into "meta-nodes" and also by condensing all the interactions between meta-nodes into only one link. The result looks like this:

This is of course much more clear. A Meta-map is a nice way to represent a system of systems whereby each node is a system with various nodes (variables). More on OntoSpace v6.0 soon.
www.ontonix.com
www.rate-a-business.com
One of the salient new features is the new display of Business Structure Maps, illustrated below. One may notice that now each node of the map has different dimensions. These are computed based on the Complexity profile, i.e. size is function of the node's importance (footprint) on the entire system. This allows to focus immediately on the important issues.
This is what the above map looked like in the previous version released in 2010.
But there is more. In very large cases, things become difficult to grasp (this happen not only with OntoSpace but in life in general). Consider, for example, the Business Structure Map of the EU (each group of nodes, depicted either in blue or red - alternating colours are used to enables users to distinguish the various groups - corresponds to a country).

Not very clear is it? In fact, the map has 632 nodes which are interconnected by 41671 rules! How do you go about analysing that? Well, you can't. For this reason OntoSpace v6.0 supports the so-called Meta-maps, which are obtained from the above map by grouping all variables into "meta-nodes" and also by condensing all the interactions between meta-nodes into only one link. The result looks like this:
This is of course much more clear. A Meta-map is a nice way to represent a system of systems whereby each node is a system with various nodes (variables). More on OntoSpace v6.0 soon.
www.ontonix.com
www.rate-a-business.com
No comments:
Post a Comment