
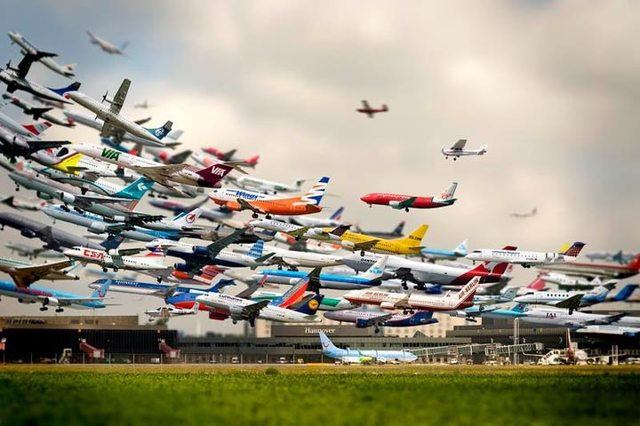
As we have seen in our previous blogs, holistic benchmarking can be applied to a wide class of problems, including images. Images originating from astronomical observations, medicine, weather radar, etc. In this short blog we illustrate the case of air traffic. In particular, we examine and compare a "critical" (very high volume) traffic situation to a "standard" one, the intent being to actually measure the difference between the two. For the purpose we use two traffic density maps. Both images are illustrated below together with the corresponding Complexity Maps as obtained using OntoBench, our holistic benchmarking system.

Based on the comparison of the topologies of the
two Complexity Maps (reference image has complexity C = 275.49, while
the second has C = 302.15) which is more significant than a simple
comparison of image complexities (or entropies) one obtains that the
degree of image similarity is 59.56%. Consequently, the difference
between the second and first image is, globally speaking, 100 - 59.56 =
40.44%.
Based on the analysis of image complexities one may state that the overall difference between the two scenarios is 100 – 59.56% = 40%. In other words, the “critical” situation is 40% more “severe” (or complex) than the baseline.
www.ontonix.com
No comments:
Post a Comment